Snow load data · OH
Ground snow load in Ohio
By Nivometra · Updated September 28, 2026
Ohio’s snow history is recorded by 223 measurement stations in the federal ERDC/CRREL SR-20-1 dataset, with 6,139 station-years of observations at elevations from 480 to 1,310 ft. Across the 200 stations with a published 50-year value, estimates range from 8 to 36 psf, with a median of 17 psf.
- stations with a 50-year estimate
- 200
- median station estimate
- 17 psf
- highest station estimate
- 36 psf
Highest 50-year estimates in Ohio
These are the stations with the highest 50-year ground snow load estimates in the state. Each value is a statistical estimate derived from that station’s snow record, not a measured load, and not a design value for any particular address.
| Station | Elevation | 50-yr estimate | Years of record |
|---|---|---|---|
| Ashtabula | 690 ft | 36 psf | 19 |
| Geneva 4 SW | 850 ft | 36 psf | 10 |
| Sayre | 890 ft | 36 psf | 15 |
| Carpenter 4 NW | 710 ft | 33 psf | 18 |
| Marietta Lock 1 | 610 ft | 31 psf | 15 |
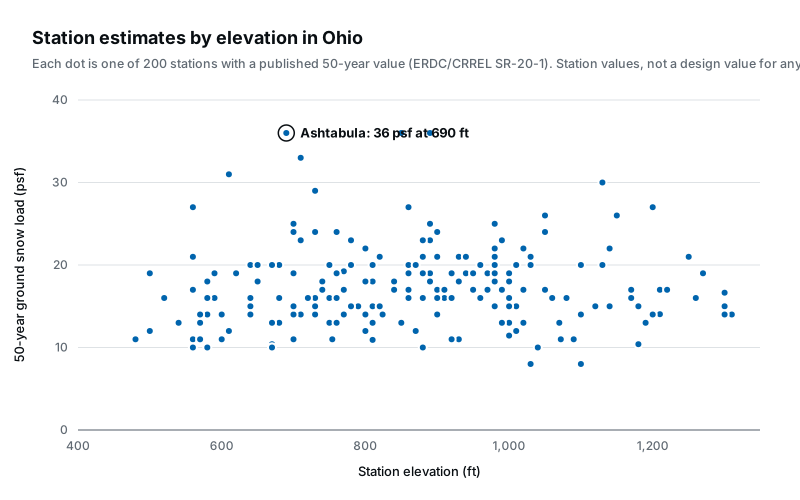
Even across Ohio’s comparatively modest 830 ft elevation spread, estimated values vary from 8 to 36 psf. Local snow climate matters more than any single statewide figure.
What these numbers are
A 50-year ground snow load is the weight of snow on the ground, in pounds per square foot, with a 2% chance of being exceeded in any given year. It is the statistical basis of the ground snow load maps in ASCE 7-16 and earlier building codes, and the form of value their site-specific case studies call for. (ASCE 7-22 moved to strength-level values on a different basis; see what changed in ASCE 7-22.)
The values above are per-station estimates from SR-20-1, the ERDC/CRREL report federal agencies use for site-specific snow load analysis. Each is derived from the snow measurements at that station, so it describes the station’s location, not your address. Between stations, the defensible way to estimate a value is the SR-20-1 case-study method: take the surrounding stations, adjust for elevation, and interpolate.
Getting a value for a specific Ohio address
If you own a building, your design snow load is set by your local building department; the guide on how much snow a roof can hold explains what the number means for an existing roof.
If you are designing one somewhere the map is coarse or marked for a ground snow load case study, Nivometra runs the SR-20-1 methodology for an exact location: it selects the relevant surrounding stations, shows you every one on the map with its elevation and record, and documents the interpolation in a report you can hand to a reviewer.
Ground snow load data for all states
This guide is educational content, not engineering advice. Structural decisions for a specific building should be made by a licensed engineer or your local building official.